Type-Hierarchy Graph
Compound types of data can contain members of elementary and compound types. Definitions of compound types of data are very often found in various files of the project and it is therefore not easy to follow and completely understand their complex organization. The Type-Hierarchy Graph in DA-C displays relations of "belonging" among types of data.
There are two types of Type-Hierarchy Graphs in DA-C: Type View and Mixed View Graphs. Type View displays only relations between data, while Mixed View additionally displays member names.
Overview
Basic Type-Hierarchy Graph Elements
Operations Independent of Graph Type
Operations Specific to the Type-Hierarchy Graph
Overview
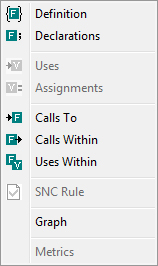
When the Editor is open in DA-C and the insertion point is positioned within a type definition or structure name, the Graph menu appears as on the following figure:
Menu for opening Type Graphs
In the Options > Graph dialog, (General tab) you can set which type of Type Graph is opened first and the type of graph can be changed after opening.
You can open Type Graphs from the Editor, the Browser and the Project Explorer via the shortcut menu on the name or compound type variable.
On the Graph menu click Type-Hierarchy graph and then select Type view or Mixed view.


Basic Type-Hierarchy Graph Elements
Basic graph elements are: type, name and group nodes and branches.
Type Nodes and Branches
In a Type View Graph, nodes represent data types and the branches display the direction of "belonging" of the members. It is possible to distinguish between compound and elementary type nodes.
The type of data for which you have opened a graph is displayed as the starting node. The types of all members belonging to the starting type are represented on the graph as lower level nodes. To each member of a starting type corresponds a graph branch which connects the starting node with the lower level nodes.
The depth to which member expansion goes on opening a graph can be set in the Options > Graph dialog (see ).
The appearance of a graph branch depends on the type of member it represents. For members according to value, the branch is a full line and for pointer members, the branch is dotted. a compound data type can contain pointers to itself and such members are represented as loops in the graph.
Name Nodes and Branches
Mixed View Graphs are used to provide a more detailed display of types because they display not only types but also member names. An additional node containing the member name is inserted here between the type and member.
Displaying elementary type nodes can be set in the Graph options dialog. In this case, in the nodes of the variable members member type and name will be displayed.