Functions for Generating Graphical Reports
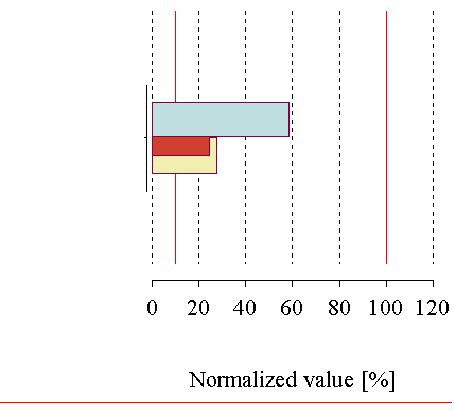
GetAllMetricsReports Function
GetMetricsReport Function
GetFlowChart Function
GetCallGraph Function
GetTypeGraph Function
FormatColor Function
FormatCrop Function
FormatAsMosaic Function
SegmentRow Function
SegmentCol Function
GetAllMetricsReports Function
The GetAllMeticsReports function defines all metrics reports from the metrics template assigned.
Declaration:
GetAllMetricsReport( TCollection<image> MetricsReport, string TemplateName, string ObjType, string ObjName)
Parameters:
MetricsReport- output variable which identifies the metrics report,
TemplateName- name of the metrics template on the basis of which the report is generated,
ObjType- type of the object for which the metrics report is generated. For example, if it is defined in the template that the report displays metrics module parameters, and if "DIRECTORY" is entered as ObjType, the report will show the metrics of all modules in the directory assigned. The possible values of this parameter are: "PROJECT", "DIRECTORY", "GROUP", "FILE", "FUNCTION",
ObjName- name of the ObjType type object for which the metrics report is generated.
GetMetricsReport Function
The GetMetricsReport function defines a metrics report for the object assigned.
Declaration:
GetMetricsReport( image MetricsReport, string ObjType, string ObjName, string Options)
Parameters:
MetricsReport- output variable which identifies the metrics report,
ObjType- type of the object for which the metrics report is generated. For example, if it is defined in the template that the report displays metrics module parameters, and if "DIRECTORY" is entered as ObjType, the report will show the metrics of all modules from the directory assigned. The possible values of this parameter are: "PROJECT", "DIRECTORY", "GROUP", "FILE", "FUNCTION",
ObjName- name of the ObjType type object for which the metrics report is generated,
Options- unreadable code of metrics report settings (settings in the metrics report Construction dialog and the like).Example:
#{ GetMetricsReport( MetricsReport, "FILE", "MathFun.c", "##kkj" )}#
#{ FormatColor(MetricsReport, "GRAYSCALE") }#
#{ begin_image( MetricsReport ) }# ...
#{ end_image }#
GetFlowChart Function
The GetFlowChart function defines Flowchart of the function assigned.
Declaration:
GetFlowChart( image FlowChart, string FunctionName, string ModulePath, string Options )
Parameters:
FlowChart- output variable which identifies Flowchart assigned,
FunctionName- name of the function whose Flowchart is defined,
ModulePath- path of the module in which the function assigned is defined. If the function assigned is global, ModulePath can be an empty string - "",
Options- unreadable code which appears when you adjust a figure in Editor manually (defines the expansion level of certain structures, and so on).Example:
#{ GetFlowChart( FlowChart, "Min_max", "MathFun\Interpolations.c", "##kbf33/jw-0hklejh##" ) }#
#{ begin_image( FlowChart ) }#
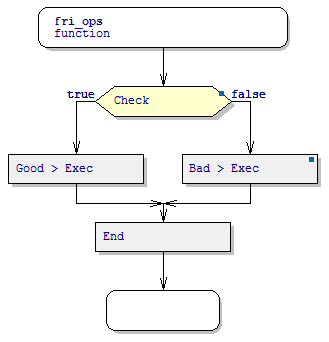
Flowchart of the Min_max function
#{ end_image }#
GetCallGraph Function
The GetCallGraph function defines the Call Graph of the function, group or view assigned.
Declaration
GetCallGraph( image CallGraph, string ObjectName, string ObjectPath, string UsedView, string Options )
Parameters:
CallGraph- output variable which identifies the Call Graph of the function assigned,
ObjectName- can be:- Name of a function - for the definition of the Call Graph of the function assigned
- Name of a group preceded by the word Group (for example "Group DataFunctions") - for the definition of the Call Graph of the assigned graph group.
- "Root Functions" - for the definition of the Call graph of the root functions
- empty string ("") - for the definition of the function graph on the basis of the view assigned.
ObjectPath- when withObjectNameyou specify the name of a static function, then, this parameter should contain the path of the module in which the assigned function is defined. Otherwise, this parameter should be an empty string - "".
UsedView- name of the view used to generate the graph. If this parameter is an empty string (""), the default view will be used to construct the graph.
Options- the unintelligible code of manual figure adjustment in the Call Graph (defines the number of levels which are displayed below certain nodes, manual node layout, and so on).Example:
#{ GetCallGraph( CallGraph, "Min_max", "" , "", "##kjf0bf33/jw-0hklejh##") }#
#{ begin_image( CallGraph ) }#

Min_max function Call Graph
#{ end_image }#
GetTypeGraph Function
The GetTypeGraph function defines the graph of the data type assigned.
Declaration:
GetTypeGraph( image TypeGraph, string TypeName, string ModulePath, string UsedView, string Options )
Parameters:
TypeGraph- output variable which identifies the graph of the type assigned,
TypeName- name of the type whose graph is being defined,
ModulePath- path of the module in which the type assigned is defined. If the type assigned is global, ModulePath can be an empty string - "",
UsedView- view which is to be used for constructing the Type Graph – this parameter can have the value "MIXED" for the mixed view graph or "TYPE" for the Type View Graph,
Options- unreadable code of manual figure adjustment in Editor (defines the number of levels which are displayed below certain nodes, manual node layout, and so on).Example:
#{ GetTypeGraph( TypeGraph, "complex", "", "MIXED", "##kjf33/jw-0hklejh##" ) }#
#{ begin_image( TypeGraph ) }#

#{ end_image }#
FormatColor Function
The FormatColor function defines how the image generated by DA-C will be integrated into GD (as a color image or as a grayscale one). If the FormatColor function has not been entered in the template, the image will be integrated as a color image.
Declaration:
FormatColor( image ImageID, string IsColor )
Parameters:
ImageIDidentifier of the image formatted.IsColor defines whether the image will have color or grayscale formatting (the possible values of this argument are "COLOR" and "GRAYSCALE").
Example:
#{ GetFlowChart( FlowChart, "Min_max", "## A2-56-8FE-D5##" ) }#
#{ FormatColor( FlowChart, "COLOR" ) }#
FormatCrop Function
The FormatCrop function defines whether an image generated by DA-C will be integrated into GD with cropped extra white space around the image borders. When an image is integrated in the form of a mosaic, that is, when the FormatAsMosaic function has been entered, cropping extra white space will be carried out only in case the image is small enough that it can fit one mosaic image. When a sole picture is integrated into GD, apart from cropping extra white space, the FormatCrop function insures that the dimensions of the integrated image do not expand in order to fill in the specified space, but they can only be made smaller.
If the FormatCrop function is not entered in the template, the image will be integrated without cropped extra white space.
Declaration:
FormatCrop( image ImageID, string Crop )
Parameters:
ImageIDidentifier of the image formatted.
Cropdefines whether extra white space around the image borders will be cropped (the possible values of this argument areCROPandNOCROP).Example:
#{ GetFlowChart( FlowChart, "Min_max", "", "## A2-56-8FE-D5##" ) }#
#{ FormatCrop( FlowChart, "CROP" )
FormatAsMosaic Function
The FormatAsMosaic function defines whether an image will be integrated into GD as a mosaic with specified segment dimensions. If the FormatAsMosaic function has not been entered in the template, the corresponding graphics report will be integrated into GD as a single image.
Declaration:
FormatAsMosaic ( image ImageID, int Width, int Height)
Parameters:
ImageIDidentifier of the figure formatted
Widthwidth of figure segment (in mm)
Heightheight of figure segment (in mm)Note: If at the FormatAsMosaic function call zeros are entered for the values of the parameters Width and Height, then, the image will be integrated into GD as a mosaic with dimensions that correspond to one side of GD.
Example:
#{ GetFlowChart( FlowChart, "Min_max", "", "## A2-56-8FE-D5##" ) }#
#{ FormatAsMosaic( FlowChart, 150, 250 ) }#
FormatBorder Function
The FormatBorder function defines whether the figure to be integrated into GD has a border or not. If the FormatBorder function has not been entered in the template, the figure will not have a border.
Declaration:
FormatBorder( image ImageID, string IsBorder )
Parameters:
ImageIDidentifier of the figure formatted
IsBorderdefines whether the image will have a border or not (possible values of this argument are "BORDER" and "NOBORDER")Example:
#{ GetFlowChart( FlowChart, "Min_max", "", "## A2-56-8FE-D5##" ) }#
#{ FormatAsMosaic( FlowChart, 150, 250 ) }#
#{ FormatBorder( FlowChart, "BORDER" ) }#
SegmentRow and SegmentCol Functions
The functions SegmentRow and SegmentCol generate the mark of the current segment in the mosaic displayed. These functions can be used solely within the Image directive. The SegmentCol function generates a move within the segment in relation to the first (upper-left) segment of the figure on the X-axis (expressed through the number of segments), and the SegmentRow function generates a move of the current segment in relation to the first segment on the Y-axis (expressed through the number of segments). The functions SegmentRow and SegmentCol can be used solely within the Image directive.
Declaration:
int SegmentCol() int SegmentRow()
Example:
#{ GetCallGraph( CGraph, "Root Functions", "", "", "##kfjoiw'j-kur8(7jfioe##" ) }#
#{ FormatAsMosaic(CGraph, 128, 234 ) }#
#{ begin_image( CGraph ) }#

#{ end_image }#