Source Code Metrics Charts Options
Offers access to dialog box in which you can set graphics form parameters which represent metrics reports. You can also specify active metrics report default settings here, and they will be effected on all future metrics reports. Previously created metrics reports will not be affected by changes in this dialog box.
By choosing the Configure command from the toolbar, you can specify settings for each individual metrics report. The configuration of an individual metrics report specified in this manner is valid only for this particular metrics report and will not affect the default settings specified in the Options > Metrics dialog box.
The selected default configuration, as well as the individual configurations of each of the existing metrics reports, is saved as part of the metrics template.
To follow is a detailed description of how to set each of the existing DA-C graphics, as well as some shared settings.
Bar Chart
Column Chart
Pie Chart
Radar Chart
Table
Bar Chart
Chart / Width
This parameter defines the width of the printed chart, unless the Fit to Page check box is selected. Given the proportional display of the elements of the bar chart in the window (not on paper), changing chart width alters the dimensions of the area taken up by the axis.
Bar / Inter-gap
The space between two bars of adjacent series for one value of the independent variable. The value of this space is expressed in percentages in relation to the width of a single bar.
Bar / Intra-gap
The space between two bars of adjacent values of the independent variable (label). The extent of this space is expressed in percentages in relation to the width of a single bar.
Bar / Height
Bar height in millimeters. This dimension refers to the printed image, while the screen image is proportional to the size of the window and to the corresponding dimension of the entire chart.
Text Axis / Width
The width of the area taken up by the vertical axis and the markings on it. This dimension refers to the printed image, while the screen image is proportional to the size of the window and to the corresponding dimension of the entire chart.
Text Axis / Label angle
The angle, in degrees, at which value markings are displayed on the vertical axis, measured in relation to normal horizontal text position.
Numeric Axis / Height
The height of the area taken up by the horizontal axis and the markings on it. This dimension refers to the printed image, while the screen image is proportional to the size of the window and to the corresponding dimension of the entire chart.
Numeric Axis / Label angle
The angle, in degrees, at which value markings are displayed on the horizontal axis, measured in relation to the vertical axis.
Numeric Axis / Grid
Defines whether the image will have lines coordinated with the noted values on the numeric (horizontal) axis.
Styles
Font
Background

Column Chart
Chart / Width
This parameter defines the width of the printed chart, unless the Fit to Page options selected. Given the proportional display of the elements of the bar chart in the window (not on paper), changing chart width alters the dimensions of the area taken up by the axis.
Column / Inter-gap
The space between two bars of adjacent series for one value of the independent variable. This space is expressed in percentages in relation to the width of a single bar.
Column / Intra-gap
The space between two bars of adjacent values of the independent variable (label). This space is expressed in percentages in relation to the width of a single bar.
Column / Width
Column width in millimeters. This dimension refers to the printed image, while the screen image is proportional to the size of the window and to the corresponding dimension of the entire chart.
Text Axis / Height
The height of the area taken up by the horizontal axis and the markings on it. This dimension refers to the printed image, while the screen image is proportional to the size of the window and to the corresponding dimension of the entire chart.
Text Axis / Label angle
The angle, in degrees, at which value markings are displayed on the horizontal axis, measured in relation to the vertical axis.
Numeric Axis / Width
The width of the area taken up by the vertical axis and the markings on it. This dimension refers to the printed image, while the screen image is proportional to the size of the window and to the corresponding dimension of the entire chart.
Numeric Axis / Label angle
The angle, in degrees, at which value markings are displayed on the vertical axis, measured in relation to normal horizontal text position.
Numeric Axis / Grid
Defines whether the image will have lines harmonized with the noted values on the numeric (vertical) axis.
Styles
Font
Background

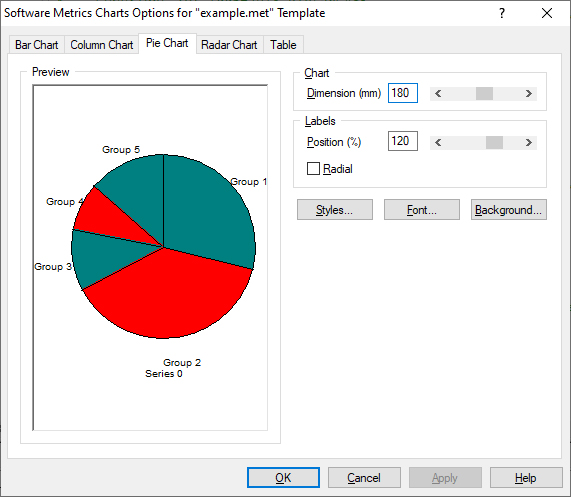
Pie Chart
Chart / Dimension
This is the largest dimension of the chart on paper (height or width, depending on the position of the labels in the report in question). This option does not affect the on-screen presentation of the chart.
Labels / Position
Label position in relation to the center of the circle. The position is given in percentages in relation to the dimension of the circle radius.
Labels / Radial
Defines whether the pie segment labels will appear along the radial lines or horizontally.
Styles
Font
Background
Radar Chart
Chart / Dimension
This is the largest dimension of the chart on paper (height or width, depending on the position of the labels in the report in question). This option does not affect the on-screen presentation of the chart.
Labels / Position
Label axis position in relation to the center of the circle. The position is given in percentages in relation to the dimension of the circle radius.
Labels / Radial
Defines whether the axis labels will appear along the axis or horizontally.
Axis / Grid
Defines whether concentric circles will appear for each of the values noted on the axis.
Axis / Label angle
Angle, in degrees, under which labels for the values on the axis in relation to the axis line are displayed.
Styles
Font
Background

Table
Grids
Defines whether the table will be displayed with or without grid lines.
Stripes
Defines whether the table will or will not be displayed with green and white stripes.
Decimal Places
Defines the accuracy of the values shown in the table.
Styles
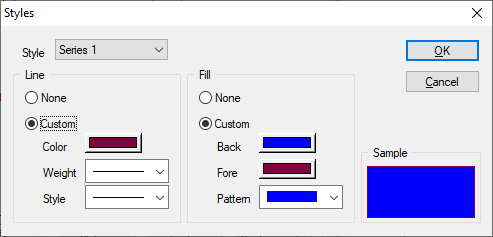
Clicking the Styles button on the tabs for adjusting the form in which graphs of the Bar, Column, Pie, and Radar type are displayed opens the following dialog box:
The form of certain elements of a particular graph is adjusted here. Although the dialog box looks exactly the same regardless of which graph it has been called for, the settings specified here are valid only for the type of graph from whose tab the Styles dialog box was called.
Style
Enables you to select the element whose form is to be adjusted: the form for seven different data series can be adjusted. The adjusting is carried out separately for the parameter values which do not exceed the prescribed scope of values ("good" series) and for the parameter values which exceed the prescribed scope of values ("bad" series), as well as for the metrics report legend, text axis, grid, limit lines.
Line
Enables you to select the color, thickness, and style of the line which delimits the element.
Fill
Enables you to select element color. The color in the Back box is the color in which the element is displayed, and the color in the Fore box is the color in which the element is displayed when selected in a metrics report.
Fill / Pattern
Enables you to select the type of pattern with which the selected element will be filled.
TIP: It is possible to introduce a change in the style of a particular element of a metrics report by double-clicking the desired element in the sample chart of the Options > Metrics dialog box.

Font
Clicking the Font button on the tabs for adjusting the form in which graphs of the Bar, Column, Pie, and Radar type are displayed opens the following dialog box:
The font in which the data in the metrics report will be displayed is selected here.

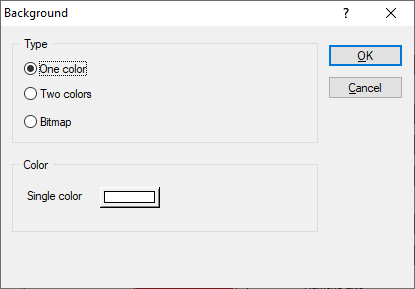
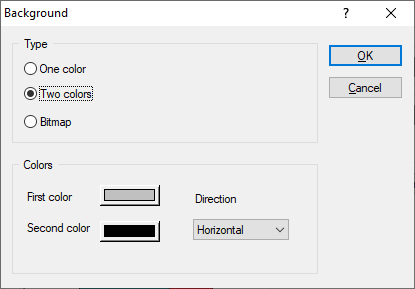
Background
Clicking the Background button on the tabs for adjusting the form in which graphs of the Bar, Column, Pie, and Radar type are displayed opens the following dialog box, in which the background of a particular type of metrics report can be set:
You can choose between a monochrome background fill and a shaded background fill, or an arbitrary bitmap read from the existing file can act as the background.